Pie Charts in the Land of Confusion: Of Cakes and Camemberts
23 Mar 2019Overview
The pie chart is a very successful way of displaying proportions. However, it was never properly named by it's inventor William Playwright.
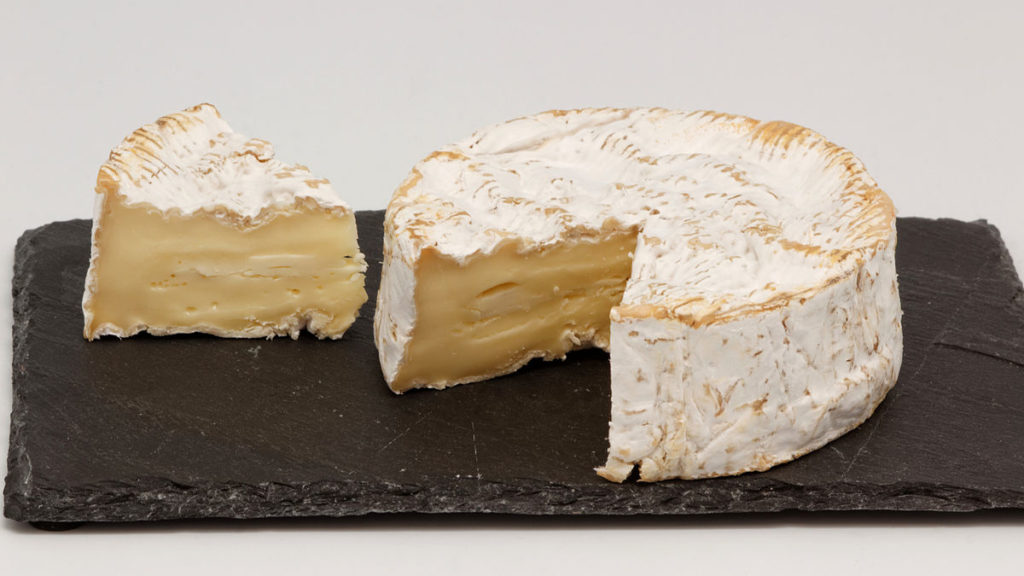
It has different names in different languages, but apparently often based on food. Pie in English, Cake in German, Pizza in Portuguese, and Camembert in Frech. This sparked my interest what else is out there. To solve this, I made a short Google Cloud program to translate "pie chart" to 103 different languages and back. I found that there are more odd cases than Camembert, such as "cookies" in Hmong, "skin" in Samoan, or "chart chart" Kazakh. These results are established via Google Cloud Translate only and not verified by native speakers.

Introduction
Pie charts are roughly 200 years old and are a very popular form of displaying proportions. Also, pie charts were not properly named when they were introduced.
Many of the names used for this chart around the world are based on food. For example, in German "pie chart" translates to "Tortendiagramm" which literally translated would be a "cake diagram". What prompted this investigation was this tweet. This post digs a bit into this phenomenon but I was curious whether I can go further. I thought there must be more to pie charts around the world.
Translations
As the year is 2019, all such investigations must involve the cloud. Therefore I used the Google Cloud Translate API to explore the depths of pie charts in 103 different languages.
In a first step I checked how the German and French case translate back to English. Theoretically, a flawless translation would go from "pie chart" to ? to "pie chart". This is called round-trip translation and considered a controversial quality metric for automated translation.
However, a literal translation would lose the original meaning and possibly expose different meanings. This is through limit of context - the translation engine makes a best effort picking out of multiple possibilities. While "camembert" translates back as "camembert", by adding more context translating "draw me a pie chart" translates to French as "me dessiner un camembert" and back identically. However, these literal translations due to lack of context are great for the purpose of this project.
To verify this briefly I translated the word to French and German - and back. Google Cloud Translation results in "Cake chart" and "Camembert". (The code for this is in the repository, function "de_fr_only".) As this worked out I went on to translate "pie chart" from English to 103 available languages, and back. The code is available here.
A note on limitations: I only receive one result per translation, languages could have several expressions for pie charts, I will only see one. Furthermore, the translations might simply be imperfect.
Results
Google cloud translation API supports 103 languages other than English. I wrote this program to translate "pie chart" to all of these languages and back.
The results are in the file all_the_pies.json, which is a JSON dictionary with two keys: "pie_to_foreign", and "foreign_to_pie". Each element contains a list "from" and "to", with the language indicator and the expression. This data structure is more verbose than required, a dictionary indexed by two-letter language code would have been sufficient for each. I did it this way as I wasn't sure what I want to do with the data later, and 103 languages are not all that much in the grand scheme of things.
When looking at the data, I noticed 74/103 of these are pie based, however, only 67 are "pie chart". Greek doubles the effort with "pie pie", Bengali has a "pie image", Portuguese is hedging bets with "pizza pie". Furthermore, "board pie": Haitian Creole, "graphic pie": Corsican, but most on-point is Afrikaans: "pie". 4/103 are cake based, however: 2x "diagram", 1x "chart" and 1x "table". I guess we could say that the pie chart takes the cake!
Other than cakes and pies or previously discussed examples, these 24 are different than the others.
- card - Estonian
- cart shape - Yoruba
- chart chart - Kazakh
- circular chart - Vietnamese
- circular diagram - Bulgarian, Persian, Slovenian
- circular graph - Croatian, Galician
- diagram - Basque
- drawing - Hausa
- glassy table - Tajik
- Graph of proportions - Romanian
- Hidden chart - Pashto
- organizer - Igbo
- papa map - Maori
- pastry photo - Azerbaijani
- Pirate Chat - Sinhala
- Point plan - Luxembourgish
- skin - Samoan
- table - Somali
- table of the patient - Swahili
- tablet - Hawaiian
- the cookies - Hmong
Notably only "pastry photo" and "the cookies" are food based, all others are not related to food. I.e. 22/104 languages supported in Google Translate use an analogy not related to food for their expression of pie charts. While running this set me back 12 cents in cloud compute cost, I would argue that this insight was worth every penny!
Closing Thoughts
The majority of languages seems to relate pie charts to food, and within that mostly to pies. There are several notable exceptions that might seem obscure to English speakers. However, it remains an open question whether providing a proper name by Playwright for his creation 200 years ago would have lead to a less diverse naming situation for this chart. Maybe a good takeaway is to name inventions and systems straight away, as opposed to letting others name them.
As some might notice, this post lacks any actual pie charts. If you have been reading until here to see a pie chart, you have been tricked!